SPC /GRR Data Charts and Reporting
- Drag Drop
- Control Logic
- Custom UI
- Reporting
- Hardware
- Scripting
- Motion Paths
SPC /GRR Data Charts and Reporting

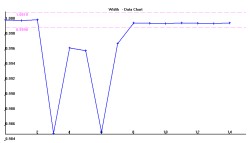
The results data in Automation Manager automatically creates an SPC data chart for each characteristic. These charts allow easy viewing of current and historic data compared to the tolerance for each characteristic. The data from these charts can be logged and exported to xml and csv files.
The data can be analysed to produce GRR reports
Other outputs include; csv and xml file and custom images can be created


